When I first spoke to my friend Kreigh, who I swear is light years ahead in terms of understanding how our ecosystem works, and generally being gentle with how he uses things. Generally lives lightly, which is wonderful to see as an example. Anyway, speaking to Kreigh he would talk about water percolation tables, aquifers and regenerating water availability. I was just lost. full stop. LOST.
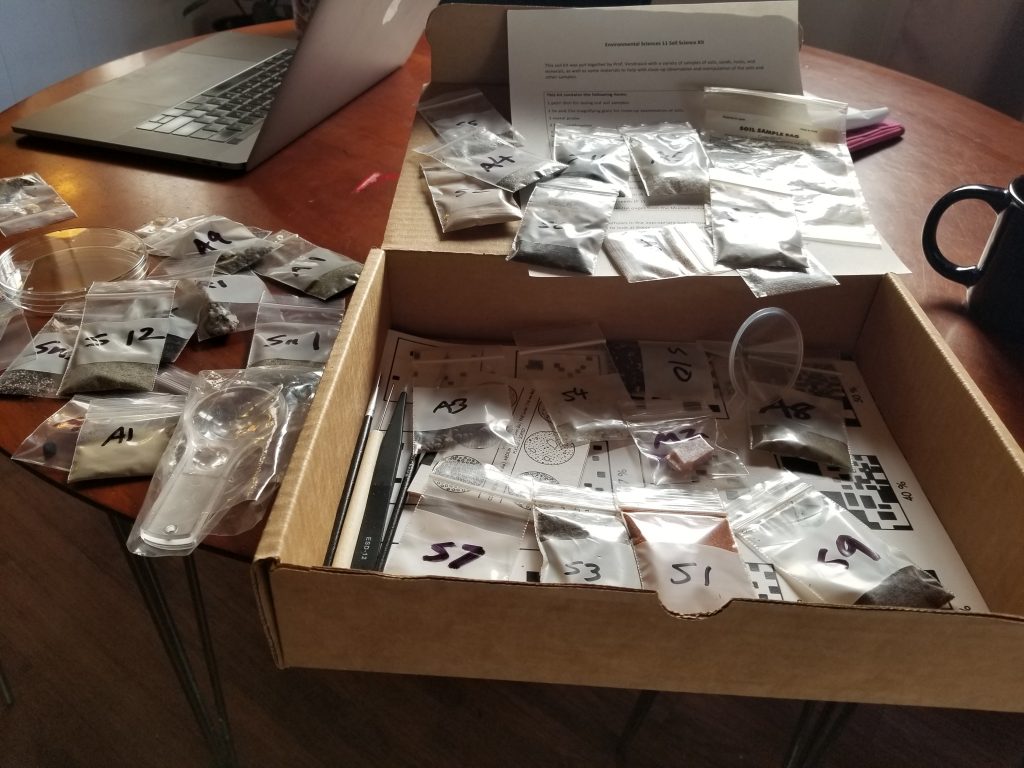
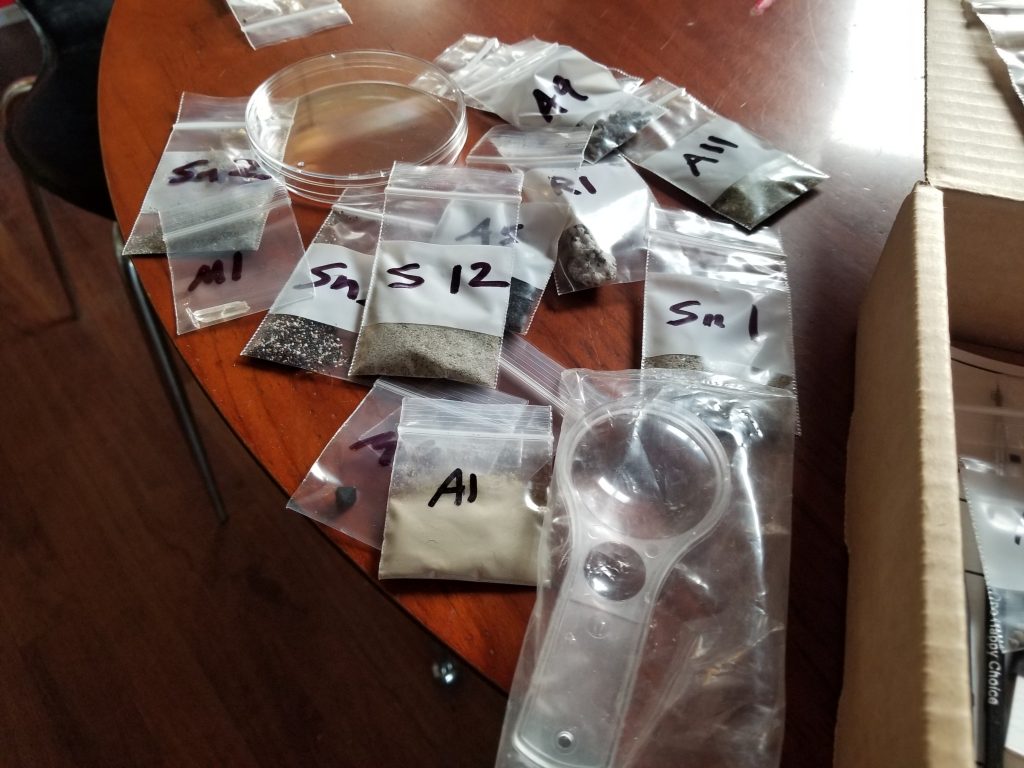
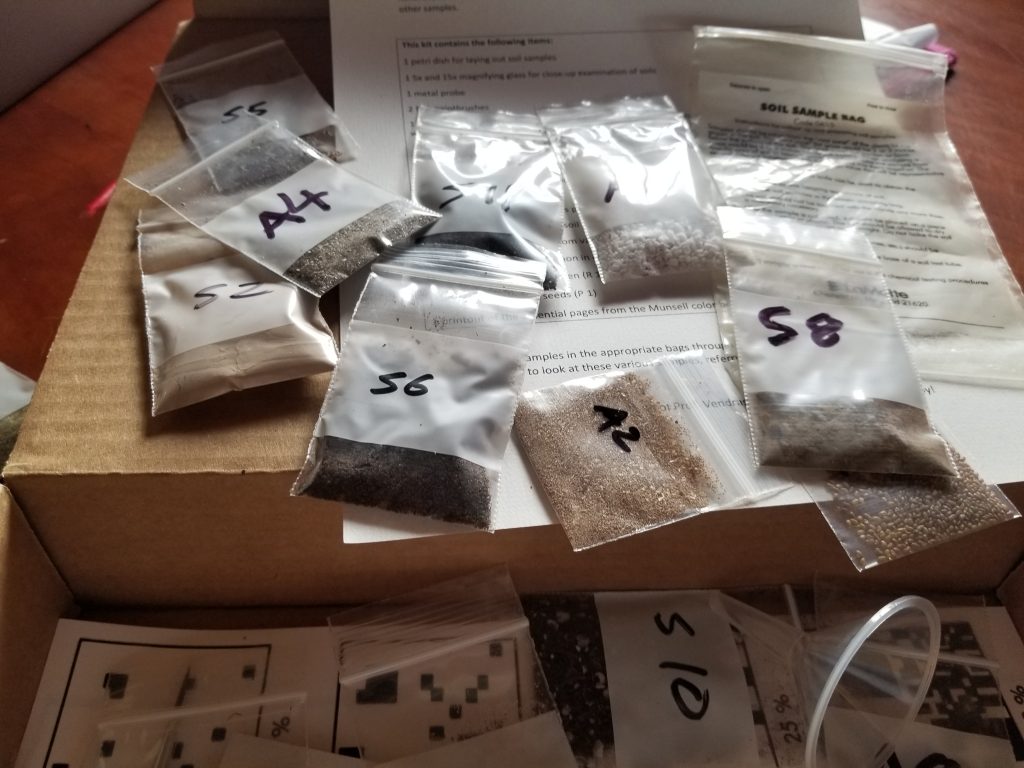
Recently, I started this soils class and it is all encompassing, it connects the dots between the biosphere and rhizosphere. This weeks assignment was learning how to use publicly available websites and data tables to understand trends going on with aquifers.
explore here: https://waterdata.usgs.gov/nwis/qw
I’m still learning so take it with a grain of salt, but you’re able to look at data by map and constrain the data by county. The larger counties like Los Angeles and San Bernardino County will take a long time to load, so be patient. I gave up because I thought my computer was crashing.
It is super useful when making observations about the decrease of water in our aquifers nationwide, but also useful when it comes to seeing how closely our water and oil wells are interconnected. Living in Los Angeles, I often think of fracking as this abstract term that is bad. Well, because it is. What I need to do is make the connection that my electricity turns on due to the natural gases extracted from shale via fracking. How is that for getting you to turn off your lights. The other connection is that these wells are not lined with cement, plastics, magical dust that protects water. The interconnectedness of our planet is both beautiful and frightening. Look at wells so close to your water and let me know what you think.
Please leave your thoughts below, and let me know if you have questions. As I’d like to address them in future posts.
